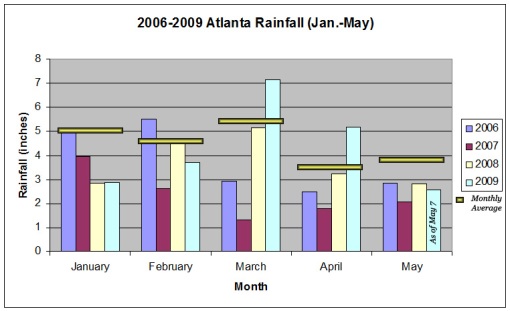
Below is a graph that illustrates the drought-breakin’-water-burstin’ spring of 2009.

As you can see, March & April provided more rain than the typical monthly average. So far this May, we’re halfway to the monthly average point- and equal to the total rainfall for the entire month in 2006-2008.
As always, current lake level can be found by clicking on the top right button on the home page.
Data for the graph was found here and here. (These are Atlanta numbers- I couldn’;t find reliable numbers for Lake Lanier)
